We thank Dr. Ramy S. Farid for generously allowing for reproduction of this discussion of CD Spectroscopy, a revised version of his online lecture notes.
It is now possible to generate a wide variety of different proteins via solid-phase synthesis and recombinant DNA methods. There is therefore a need to determine the structure of larger and larger numbers of proteins. High-resolution techniques such as NMR and X-ray crystallography that are complex and time-consuming will be overwhelmed. Therefore, there is a need for quick low resolution techniques for determining protein structure. For example, absorption, Raman, fluorescence, and primarily circular dichroism (CD) spectroscopy are commonly used to take a quick look at the structural integrity of proteins and other biomolecules. These techniques do not yield all the information the atomic coordinates would, but are very helpful to look at structural reproducibility in bioproduct manufacture, overall secondary structure, real-time refolding and other times when one wants to know if two structures are globally similar. Nearly all molecules synthesized by living organisms are optically active. If a meteorite contains optically active compounds this would suggest that life exists elsewhere in the universe. Nature is dominated by chemical isomers of one handedness over the other (for example, L-amino acids predominate over D-amino acids in most living organisms; D-sugars predominate over the respective L-isomers). Possible explanations for this involve the "seed" mechanism by which one isomer was selected early on and enzymes evolved which worked with this geometry over another or the handedness of natural irradiation. Molecules like these, which lack a mirror plane or center of inversion, are chiral and therefore modulate polarized light.
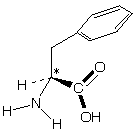
Example: L-Phenylalanine (Star indicates chiral carbon)

Ellipticity
Plane polarized light is the sum of left and right circularly polarized light. When plane polarized light passes through a solution containing an optically active substance the left and right circularly polarized components of the plane-polarized light are absorbed by different amounts. When these components are recombined they appear as elliptically polarized light. The ellipticity is defined as Q, the angle of polarization and is measured in degrees, (deg) or millidegrees, (mdeg).
Optical Rotary Dispersion (ORD)
ORD is the ellipticity that results from absorption of linearly polarized light by chiral chromophores. ORD has been replaced by Circular Dichroism (CD) spectroscopy which measures the difference in left and right circularly polarized light. Equations exist to convert ORD measurements to CD measurements.
Generating Circularly Polarized Light
Circularly polarized light is generated by passing plane polarized light through a birefringent plate (in the z-direction) which splits the light into two plane-polarized beams oscillating along different axes (x and y). When one of the beams is retarded by 90º (using a quarter-wave retarder) then the two beams which are now 90º out of phase are added together, the result is circularly polarized light of one direction. The two axes are inverted to generate circularly polarized light of the other direction. The result of adding the right and left circularly polarized that passes through the optically active sample is elliptically polarized light, thus circular dichroism is equivalent to ellipticity (e).
Summary of strengths and weaknesses of CD
CD has an important role in the structure determination of proteins, however, the effort expended in determining secondary structure elements is sometimes not worth it because it is somewhat unreliable. The real power of CD is in the analysis of structural changes in a protein upon some perturbation, or in comparison of the structure of an engineered protein to the parent protein. CD is rapid and can be used to analyze a number of candidate proteins from which interesting candidates can be selected for more detailed structural analysis like NMR or X-ray crystallography, further purification for manufacture of bioproducts etc
Far-UV CD is used for determining protein structure, amide bond electrons absorb in this energy range:
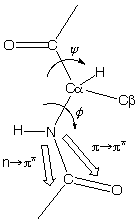
n -> p* centered around 220 nm
p
-> p* centered around 190 nm
The intensity and energy of these transitions depends on the angles the peptide bond assumes (f , y angles) and therefore on the secondary structure of the protein.
Secondary structure effects
In a folded protein the amide is in a continuous array. For example, the absorption spectrum of poly-L-lysine in an a-helix, b-sheet, and unordered (random coil) differ due to long-range order in the amide chromophore:
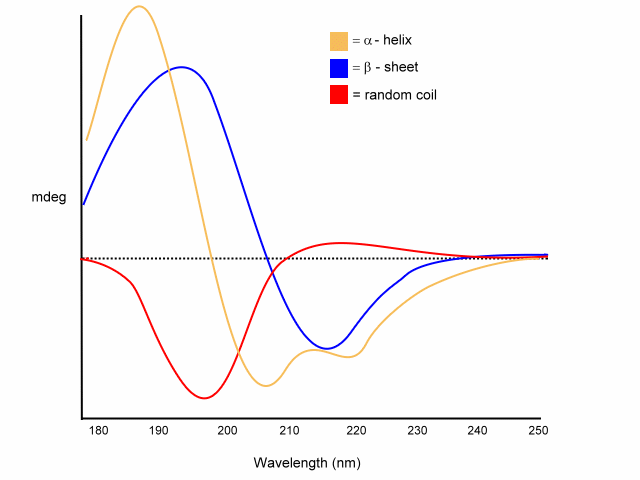
Examples of different pure secondary structures
random coil
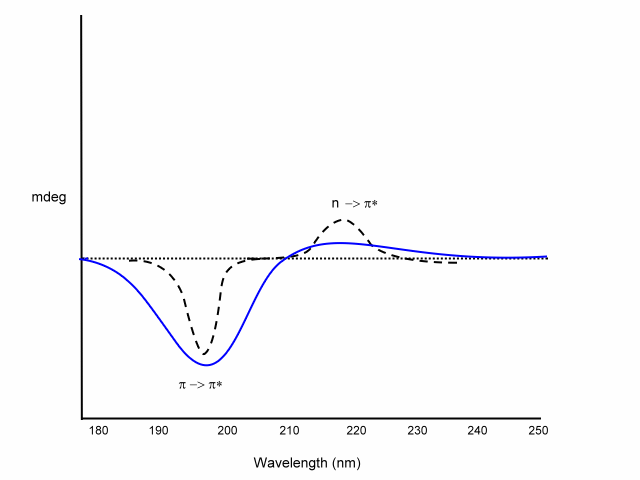
positive at 212 nm (p -> p*)
negative at 195 nm (n -> p*)
b
-sheet 
negative at 218 nm (p -> p*)
positive at 196 nm (n -> p*)
a
-helix 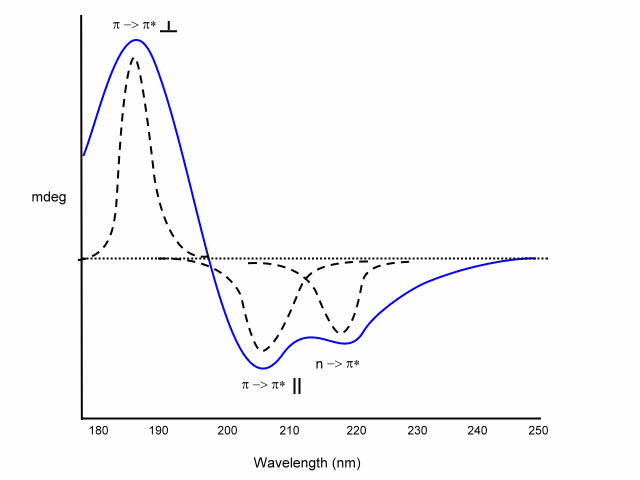
exiton coupling of the p -> p* transitions leads to:
- positive (p -> p*)perpendicular at 192 nm
- negative (p -> p*)parallel at 209 nm
negative at 222 nm is red shifted (n -> p*).
1. Generation of basis-set CD spectra
Circular dichroism spectra of "pure" secondary structures. Use far-UV CD to determine amounts of secondary structure in proteins by generate basis sets by determining spectra of pure a-helix, b-sheet, etc. of synthetic peptides or deconvoluting CD spectra of proteins with know structures to generate basis sets of each of secondary structure poly-L-lysine can adopt 3 different conformations merely by varying the pH and temperature:
random coil at pH 7.0
a-helical at pH 10.8
b-sheet form at pH 11.1 after heating to 52°C and recooling.
2. Secondary Structure determination
CD spectrum of unknown protein = A * [% a-helical] + B * [% b-sheet] + C * [% random coil]
A, B and C are derived from poly-L-lysine basis spectra. Recent equations used different peptides and proteins to determine A, B, C; e.g. A from myoglobin, B from (Lys-Leu)n in 0.1 M NaF at pH=7, C from (Pro-Lys-Leu-Lys-Leu)n in salt free neutral solution. Corrections are also included for chain length; for example:
Dependence of chain length on CD spectrum:
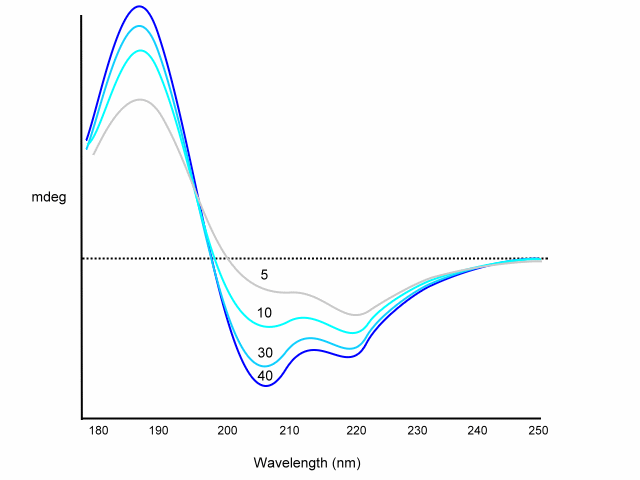
Using the above equation or similar various programs will deconvolute your CD spectrum for you. The disadvantage of this method is that although these basis sets are easily determined by direct measurement, they do not always agree from one lab to another. In addition, chain length and aggregation effect the basis set spectra. However, this method is usually accurate to within 10% for a-helix content.
|
Technique |
Secondary Structure |
carboxypeptidase |
a -chymotrypsin |
Myoglobin |
|
|
a |
23% |
8% |
68% |
|
X-ray crystallography |
b |
18% |
22% |
0% |
|
|
RC + other |
59% |
70% |
32% |
|
|
||||
|
|
a |
13% |
12% |
68% |
|
CD using (Lys)n Basis Sets |
b |
31% |
23% |
5% |
|
|
RC + other |
56% |
65% |
27% |
A number of things must be kept in mind when setting up a CD experiment. Most information is in the far UV range, but many buffers will absorb in this range and you protein itself may absorb too strongly to get a reasonable amount of light through the sample in the lower wavelengths. Some groups are now using photons from synchrotron radiation to overcome this hurdle and collect spectra below 160 nm. The absorption around 190 nm should be less than 1.0 (usually < 0.3) for cell pathlengths of 0.05 to 1 cm in order to maintain reasonable signal-to-noise ratios and accurate CD measurements. Protein concentration is typically 1 mg/mL Buffer is typically 10 mM phosphate with low salt if any. Must calibrate the instrument: typically an aqueous solution of (+)-10-camphorsulfonic acid (CSA): 1 mg/mL in 1 mm cell: De = 2.36 at 290.5 nm, DA = 1.02 x 10⁻³, ellipticity = 33.5 mdeg. At 192.5 nm ellipticity = 69.6 mdeg. To accurately determine concentration of CSA solution: A285nm = 0.743 in 5 cm cell, e285nm = 34.5 M-1 cm-1. Here is an example of the absorption of different solvents which may be considered:
Solvent Cut-Off (A=1.0) for
Two Different Cell Pathlengths
|
Compound |
1.0 mm |
0.05 mm |
|
H2O |
182 |
176 |
|
F6iPrOH |
174.5 |
163 |
|
F3EtOH |
179.5 |
170 |
|
MeOH |
195.5 |
184 |
|
EtOH |
196 |
186 |
|
MeCN |
185 |
175 |
|
Dioxane |
231 |
202.5 |
|
Cyclohexane |
180 |
175 |
|
n-Pentane |
172 |
168 |
Once you have dialyzed or exchanged the buffer of your protein to an appropriate one (Tris is not appropriate - will absorb highly in the UV range needed!!) you need to know protein concentration accurately. For proteins you may use UV absorbances:
e
190nm = 8,500 - 11,400 M-1 cm-1 per residue (this is not accurate enough: the e in the far UV of proteins depends on the secondary structure)e
280nm (in 6 M guanidinium hydrochloride) = # of Trp residues x 5,690 + # of Tyr residues x 1,280 M-1 cm-1
Measure a CD spectrum
1. Turn on the nitrogen purge which should be attached to your machine. Nitrogen is necessary to clean out oxygen out of the chambers due to absorbance effects of ambient gases, and most importantly ozone formation caused by the Xe bulbs used which can kill both you and the silver optics. Usually nitrogen is purged for about 5 minutes to be sure all the air is displaced. Boil off from liquid nitrogen tanks can be attached to your CD-spec to save on nitrogen costs.
2. Fill your quartz cell (path lengths between 0.0001 cm and 10 cm. 1cm and 0.1 cm are common) with the buffer you are using (water or 5 mM phosphate are preferred buffers). Measure cell base line with solvent.
3. Insert your sample with same cell; insert cell the same way into the machine. Be sure there is no turbidity - filter solutions after dialysis! Measure sample spectrum.
4. Using your protein concentration, amino acid chain length, molecular mass convert mdeg to molar ellipticity - the program with your machine should provide this calculation. Your spectrum is done!
5. Use the spectrum to calculate percent secondary structure.
Nucleic Acids
For nucleic acids, unlike proteins, one cannot ignore spectral differences between different monomeric residues. The nucleic acid bases themselves are directly involved in close interactions in all common secondary structures. Even some actual sequence information must be taken into account to explain CD spectra. For example the CD spectrum of the dinucleoside phosphate ApG is different from the sum of the CD spectra of A and G monomers. The CD spectra of ApG and GpU are the average of the two monomers plus and an additional term to account for the base-base interactions. In a trinucleoside diphosphate such as ApGpU, there would be contributions from three monomers, two interactions between neighboring bases, and a final contribution due to interaction between the next-nearest neighbors, A and U. This approach becomes very complex for larger nucleic acids! As for proteins, the secondary structure of DNA (B-form, A-form, Z-form) can be distinguished by CD. In fact, the first observation of Z-form DNA was by use of CD. Melting studies can also be conducted by CD. Changes in conformation can be monitored as a function of temperature and solvent.
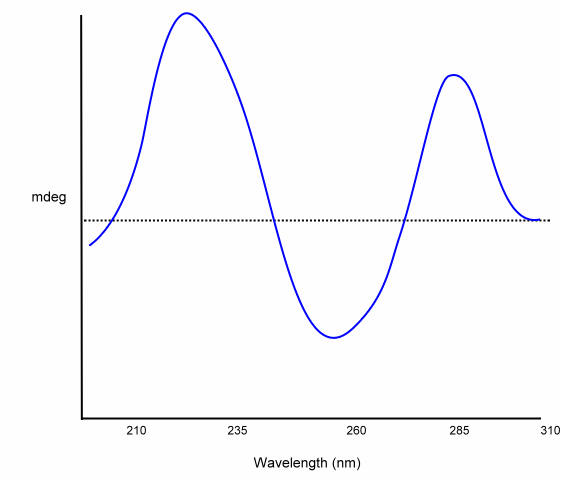
The following is an example CD for a dinucleotide:
Carbohydrates
Proteinchemist.com is looking for contributions to this section; specific questions are: what impact do sugar modifications on proteins have on the CD spectrum and what do spectra of gangliosides etc look like?